Analysis of historical stock market data
- What is the case?
- What was the scope?
- What was the problem?
What are we describing?
A methodology for performing an analysis of the potential gains and losses associated with selected stock market investment strategies, based on historical data. The description includes the successive steps in the creation of the solution: determination of needs, conditions, available data, used technology through the creation of an automatic and universal analytical code.
What did the next steps of implementation look like?
- Periods for short, medium and long-term moving averages were determined.
- Technologies suitable for data analysis were selected.
- A workflow was created to retrieve, prepare and analyze data.
- The results are presented in the form of a brief discussion and analysis results.
What did we check?
The scope of the analysis was based on 5-year historical data of an arbitrary ticker (gold was chosen in the example). The data was grouped, indicators for evaluation were calculated and 16 different combinations were created according to EMA (exponential moving average) periods.
The implementation was completed with the development and visualization of the results and the presentation of complete conclusions.
A significant challenge was to design a universal solution.
The problem was to automate the solution and optimize its versatility. This was due to such requirements as: each time the input (historical) data is updated, quick change between the selected ticker, creation of variant analysis of the proposed investment strategies, simple visualization of the results - clear and easy to interpret. The goal is to indicate the optimal among the assumptions of how to invest.
A detailed description of the problem and its solution.
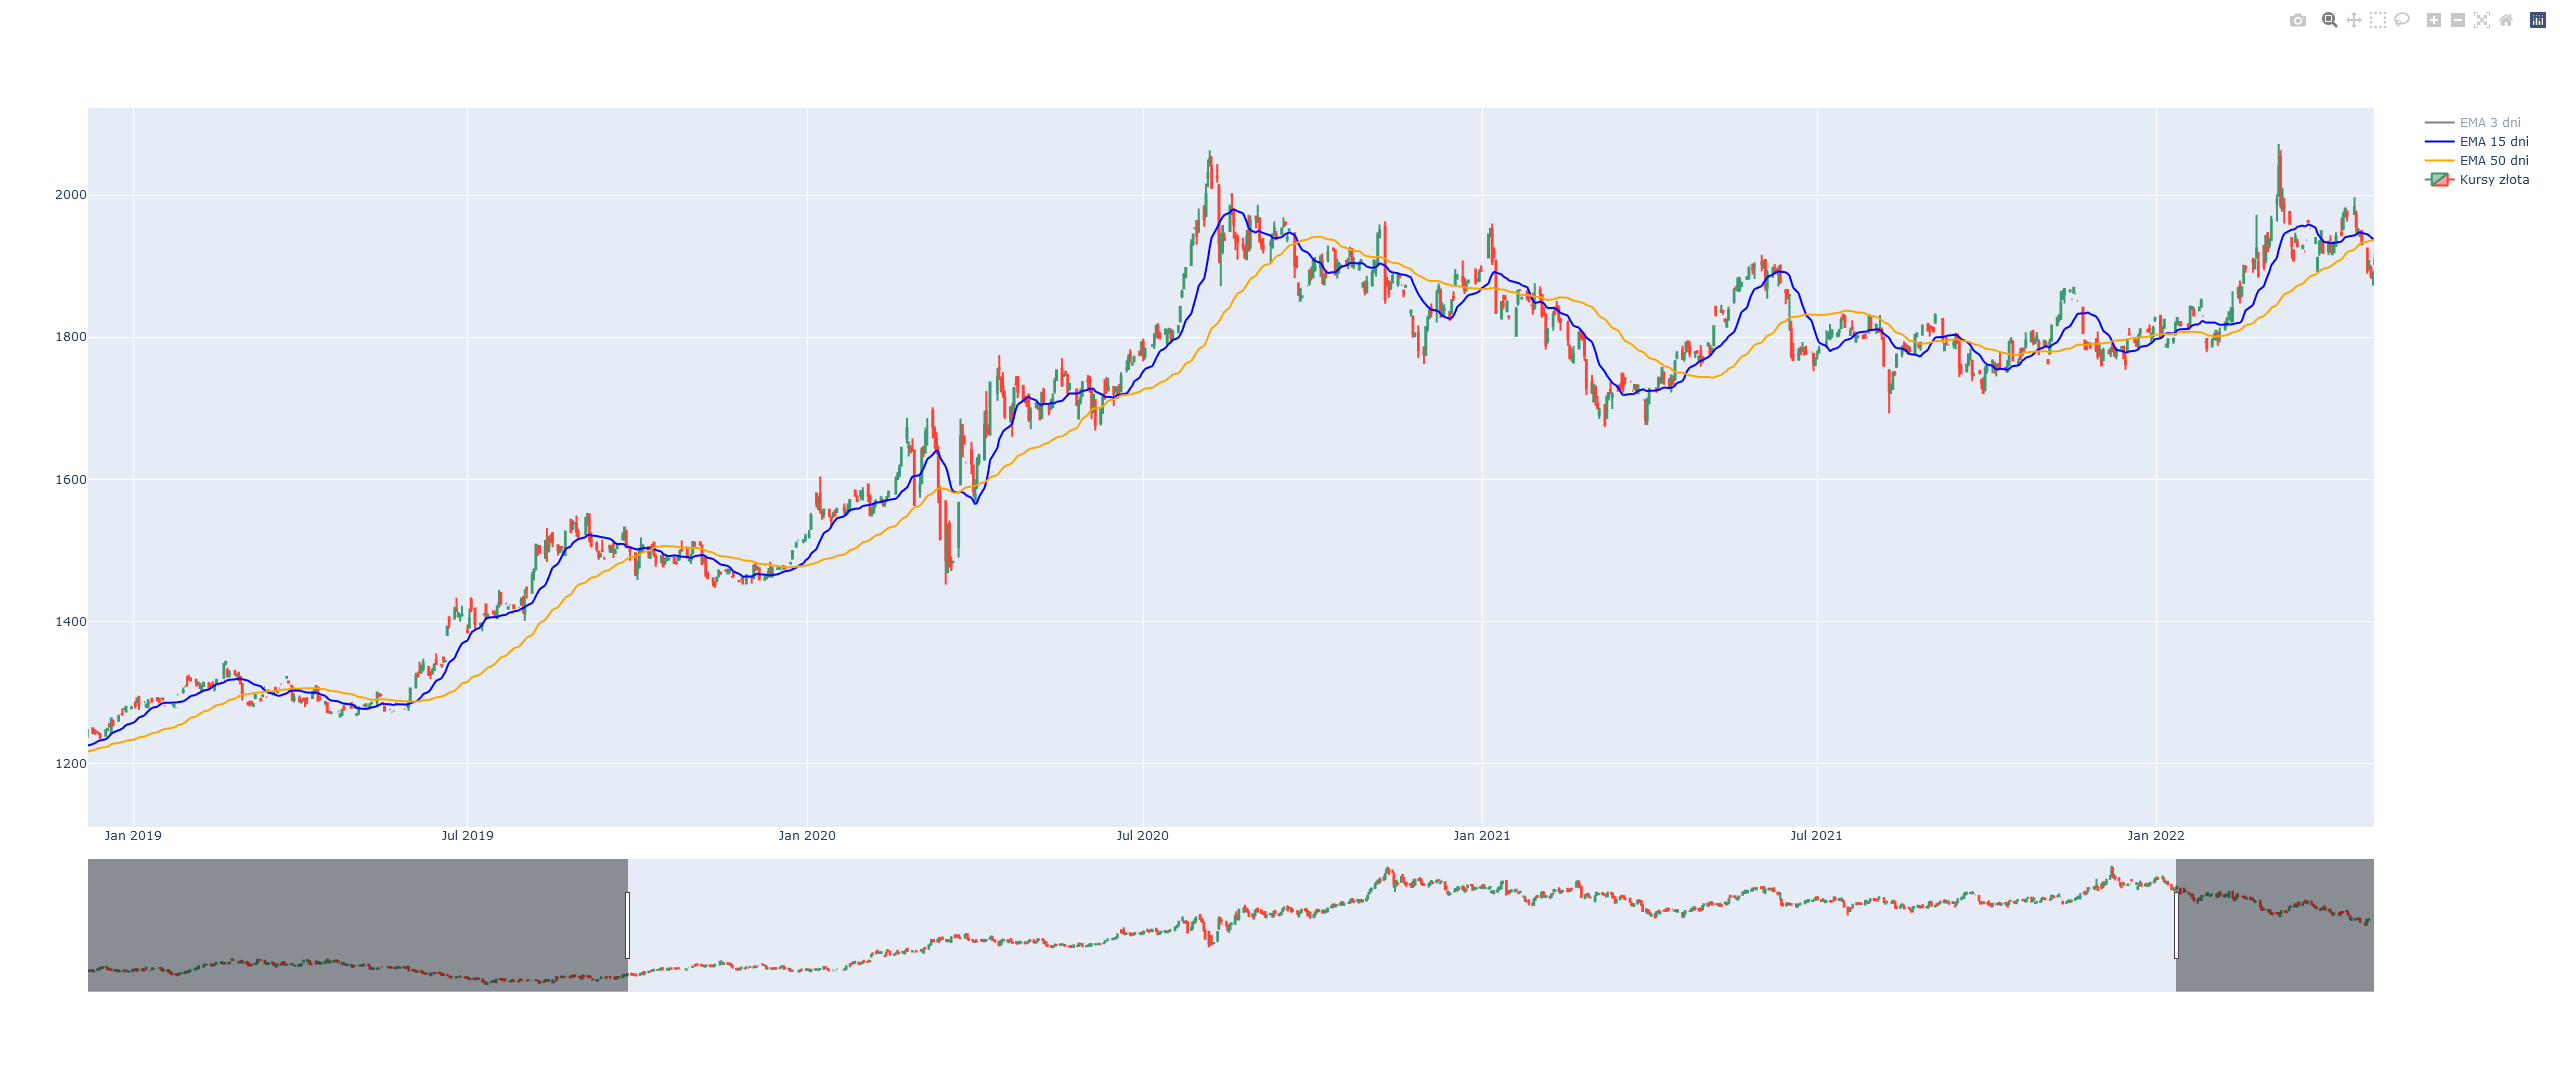
The client's order referred to the performance of an analysis of historical data of the gold price. A 5-year time period was taken as the basis. The specific assumption of the client was to perform a basic variant analysis using a moving average and excluding external factors (among others described and used in fundamental analysis). The calculations were based on the closing prices of each day.
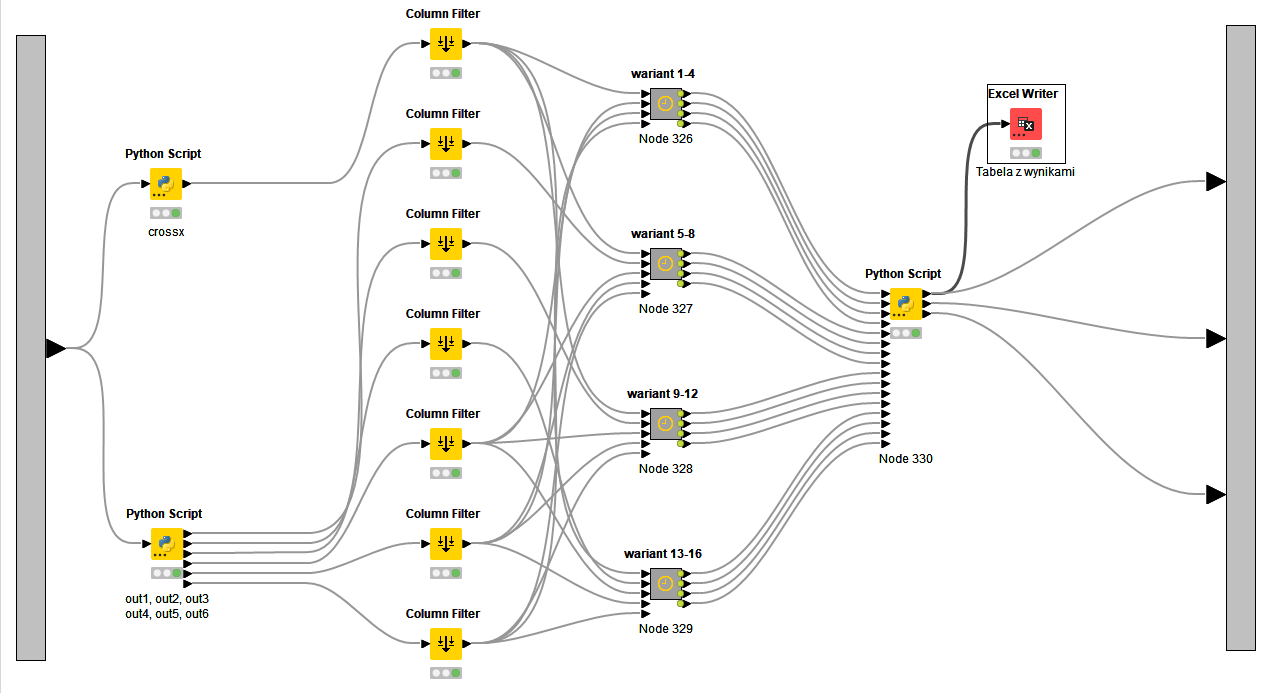
The analysis was based on popular market solutions:
- Knime analytics platform in conjunction with
- Python programming language,
which allow for complete automation of analytical and calculation processes and visualization of results in any way chosen by the user.
The first step was to create a method for retrieving and formatting / cleaning the input data. The method was obtained using Python code that generated new values each time the program was run, based on the system time and ticker provided, ensuring the most current values. The data was then checked for consistency and completeness, after which the resulting data table was further analyzed.
According to the order, three moving average values were established:
- long-term, designated by the customer as a period of 50 days,
- medium-term, with a duration of 15 days (about 1/3 of the long-term value),
- short-term - auxiliary, with a period of 3 days.
The resulting values were plotted on an interactive candlestick chart for quicker verification of later results and to point out obvious errors in the methodology:
The next step of the analysis was to clean the dataset again and isolate the data needed for further steps:
- dates,
- closing values,
- moving averages.
On the basis of the filtered closing values and EMA values, the creation of variant analysis assumptions began - that is, the determination of individual buy/sell points. These were determined based on the previously determined EMA crossover points, creating a total of 4 buy and 4 sell variants each in a separate table. Thus, investment strategies were based on a cross comparison of each of the designated points (a total of 16 different variations). Next, a comparison of profit and loss totals was made:
According to the analysis criteria (no external factors), it was determined that when trading 1 ounce of gold without using any leverage:
- The largest profit was obtained according to the 8th variant of the strategy, where $511 was earned over 5 years. This variant was based on a change in the economy determined by one of the averages and taking a BUY/SELL action with a corresponding delay.
- The worst was option 5, which provided $142.20 less profit.
- Only 4 variants were above the average determined from all 16 variants ($423.23).
It should be noted that the example described here is only an excerpt from technical analysis, and most of the well-known oscillators (including the momentum index, ROC change index, RSI indicators and others) are omitted here. This method is designed for quick and short-term evaluation of investments, determining the optimal buy and sell points at the time of analysis. A well-known practice in the stock market is to combine it with fundamental analysis, which is based on a number of macroeconomic factors (including inflation, GDP, or interest rates). This provides both guidance on what to invest in and a long-term vision.
We also invite you to see how interactive dashboards and charts work. Wystarczy kliknąć tutaj.
Glossary of case-specific definitions
- Technical analysis - a short-term type of analysis used in situations that require a quick response. The basic data needed for analysis are closing amounts and moving averages.
- Fundamental analysis - a long-term type of analysis that allows to determine changes in the trend in the long term than technical analysis. Used to determine the object of investment, based on macroeconomic data and other market, political or technological information.
- Moving average - an indicator used to analyze time series and determine current trends in the market.
- SMA - simple moving average, calculated according to the sum of the values of the period divided by the length of the period.
- EMA - exponential moving average, which additionally determines the weight for a given period according to the principle: more recent data is more valuable.
- Technical analysis oscillators - can be an additional indicator that informs about the change in trend before the visible change in closing amounts.
- Workflow - In the example, it is the definition of the workspace of the KNIME program. The workflow shows the next steps of the analysis and the connections between them.